How Can We Help?
(C) Review Progress data in Columns 1-7
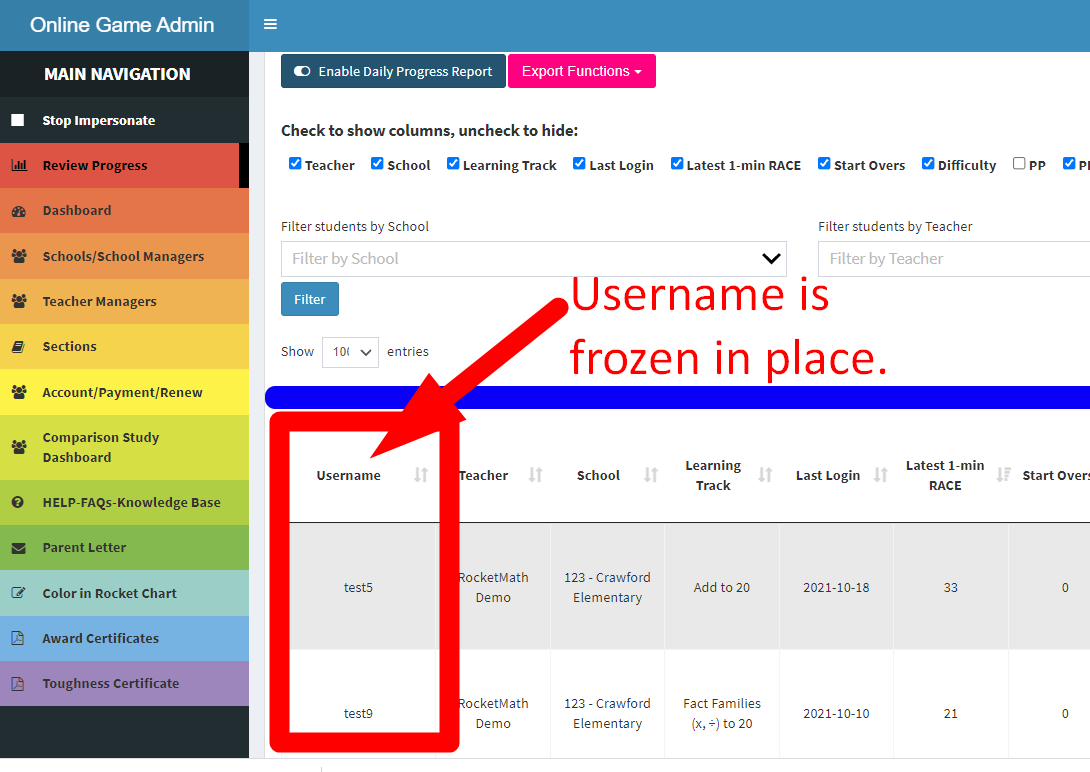
Column 1 Username. Now let’s look down at the columns in the individual student data chart. Column 1 is the username. We don’t collect personally identifiable information (or PII) so you have to work off the usernames. You can use the bright blue slider to move over to the rest of the data on the right. The username will remain frozen on the left so you can tell whose data you’re seeing at all times.
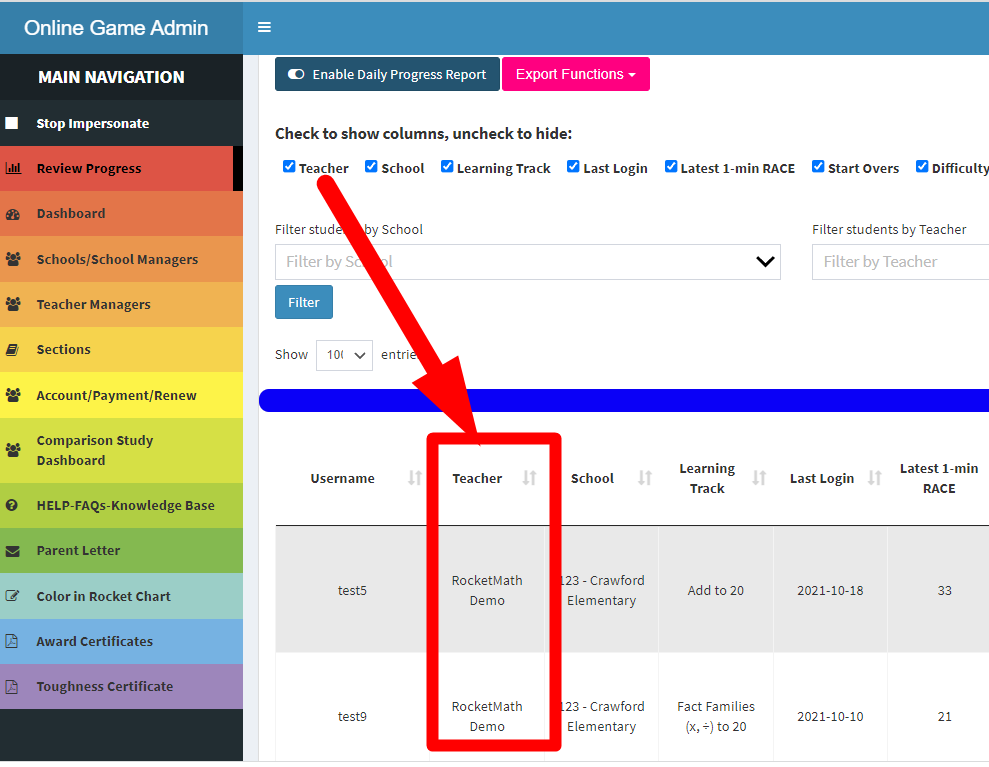
Column 2 Teacher. This column has the teacher name. Useful for the principal, and the filter function may be needed. If you’re a teacher in your own account you can safely uncheck this column and hide it.
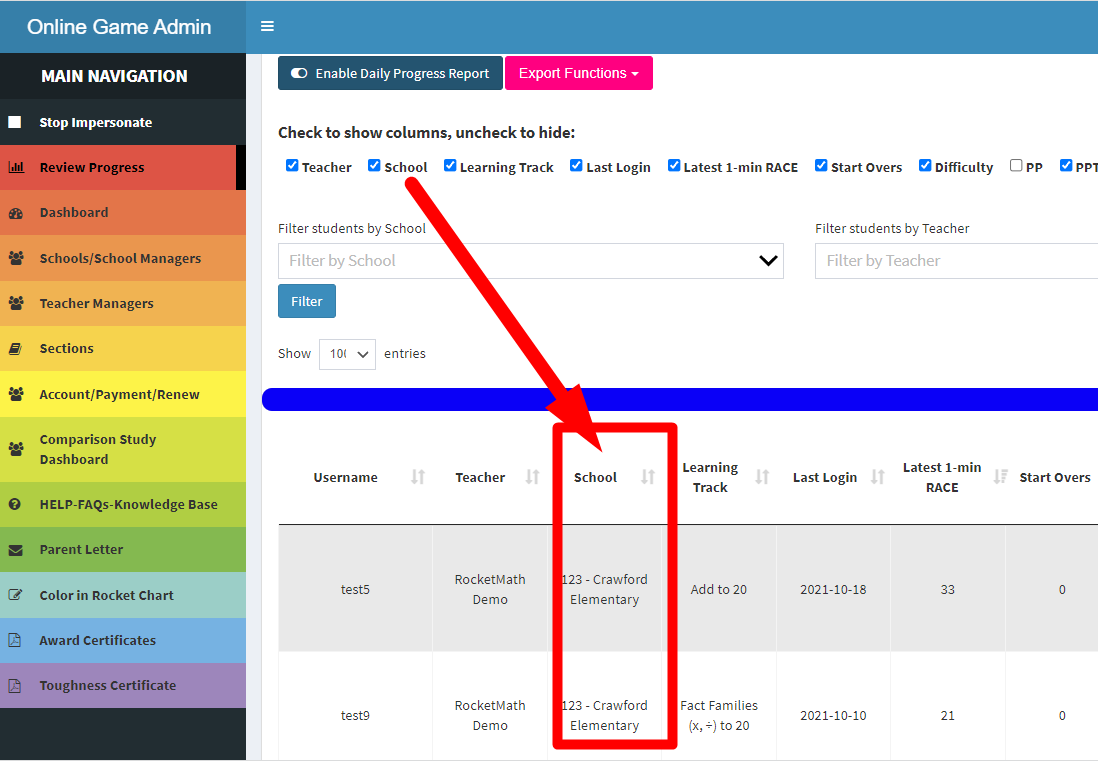
Column 3 School. This column has the school name. Useful in a multi-school account, and the filter function may be needed. If your account covers only one school you can safely uncheck this column and hide it.

Column 4 Learning Track. Seems unnecessary when you start out, but soon you’ll have students in new Learning Tracks and you’ll want to know what they are working on. With Auto-advance enabled they will move into new Learning Tracks without your intervention, so again, it will be helpful to know what they are working on.

Column 5 Last Login. This shows the most recent login for each student. If you sort this column you can find out who has not logged in recently.

Column 6 Next to Last 1-min RACE and Column 7 Last 1-minute RACE results. See how many problems each student was able to answer in their last two 1-minute races. Learn more about these races in this video about the fluency tests. Because there are the last two tests you can see fluency progress above in the cases where the two tests are from the same Learning Track. You can sort by this column to see who has done well and should probably get a fluency promotion also detailed in the video about the fluency tests.