
Every year, students enter a new math level with new math facts, but what should the students know by the end of each grade? How do teachers measure the success of their students? By using math benchmarks, teachers have a reference point to assess their students’ progress. Rocket Math Online Game and Worksheet Program are great tools to help students meet math benchmarks in every grade.
What are Math Benchmarks?
Math benchmarks are standard reference points that can be measured and assessed. Teachers use benchmarks in math to help understand where their students are in their math education and know where they need to be in order to succeed in their grade level.
1st Grade Math Benchmarks
In 1st grade, students focus on learning addition and subtraction up to 20, whole number relationships and grouping, linear measurement and lengths, and geometric shapes.
1. Addition and subtraction up to 20.
1st grade students learn strategies to build math fact fluency for adding and subtracting whole numbers up to 20.
2. Whole number relationships and grouping in tens and ones.
1st grade students learn to compare the whole numbers at least to 100 and be able to understand and solve problems involving their relative sizes.
3. Linear measurement and measuring lengths.
1st grade students learn to understand the meaning and process of measuring including the concepts of iteration and transitivity principle for indirect measurement.
4. Compose and decompose geometric shapes.
1st grade students learn how to compose and decompose geometric shapes, like creating a quadrilateral by putting two triangles together.
2nd Grade Math Benchmarks
In 2nd grade math students focus on developing students’ knowledge of base-ten notation, their fluency with addition and subtraction, standard units of measure, and analyzing shapes.
1. Base-ten system
2nd grade students learn to count by fives, tens and multiples of hundreds, and learn to recognize which digits represent amounts of thousands, hundreds, tens or ones. E.g. 456 is 4 hundreds + 5 tens + 6 ones.
2. Addition and Subtraction up to 1000
2nd grade students develop their math fact fluency in addition and subtraction up to 1000.
3. Standard units of measure
2nd grade students learn standard units of measure and how to use rulers and other measuring tools.
4. Analyze Shapes
2nd grade students learn how to examine shapes by their sides and angles, and decompose and combine them.
3rd Grade Math Benchmarks
In 3rd grade students focus on developing their multiplication and division math facts up to 100, understanding fractions, understanding the structure of rectangular arrays and are, and how to analyze two-dimensional shapes.
1. Multiplication and division math facts up to 100
3rd grade students develop their math fact fluency of multiplication and division of whole numbers up to 100.
2. Fractions and unit fractions
3rd grade students learn unit fractions and fractions and are able to use them to represent numbers equal to, less than, or greater than one.
3. Attribute of two-dimensional regions
3rd grade students learn to find the area of a shape which shows the students how to connect the area to multiplication and how to use multiplication to determine an area of a rectangle.
4. Analyze and compare two-dimensional shapes
3rd grade students compare and classify two-dimensional shapes by their angles and shapes.
4th Grade Math Benchmarks
In 4th grade, students focus on developing their math fact fluency in multi-digit multiplication and division, learn math operations with fractions, and understanding geometric figures.
1. Multi-digit multiplication & division
4th grade students understand place value to 1,000,000 and know how to apply multi-digit multiplication and multi-digit division to mentally calculate quotients.
2. Fraction equivalence and operations
4thd grade students learn that two fractions can be the same (e.g. 12/16 = 3/4) and learn how to add, subtract, multiply and divide fractions.
3. Geometric figures
4th grade students learn to describe, analyze, compare and classify two-dimensional shapes.
5th Grade Math Benchmarks
In 5th grade, students focus on developing fraction operations, learn operations with decimals to 100, and develop an understanding of volume.
1. Math fact fluency of fraction operations
5th grade students learn to apply their understanding of fractions and fraction models to calculate sums and differences of fractions in addition, subtraction, multiplication, and division.
2. Relationship between decimals and fractions
5th grade students learn to multiply and divide between decimals and fractions, and to compute quotients of decimals to 100.
3. Volume
5th grade students learn that volume is an attribute of three-dimensional space and can be measured by finding the total number of units that are needed to fill the space.
Not meeting Benchmarks: what should it mean?
When students score as “not meeting benchmark,” it means the school should provide some intervention to help the students learn. When it comes to learning math facts, most students have had no opportunity to learn them in a systematic way. Unless they have had an extraordinary school or an unusual teacher, they have not received structured, systematic learning opportunities to memorize math facts. After three decades in schools, I know this to be the case. Without systematic practice and effort, most students will not meet math fact benchmarks. They won’t meet the Common Core expectation that students will “know [math facts] by memory.” Whose fault is that? It is not the student’s fault nor the parent’s fault.
Are you certain your fluency intervention is effective?
The teacher and the school should provide, not just any “intervention” but should provide an effective intervention. Some so-called “interventions” do not reliably produce increased fluency. An essential part of using an intervention is to measure its effectiveness. [That’s why IEP goals are supposed to have measurable short-term objectives!] The best way to measure the effectiveness of a fluency intervention is with timed, curriculum-based fluency assessments.
By measuring the same way for the same amount of time period, you can see if fluency increases. If the student can complete more items during the timed test each time you measure, you can see their fluency increase. When a vast majority of your students, or all of your students, improve in fluency, then you can be certain that the intervention is effective.
Rocket Math Online Game is effective
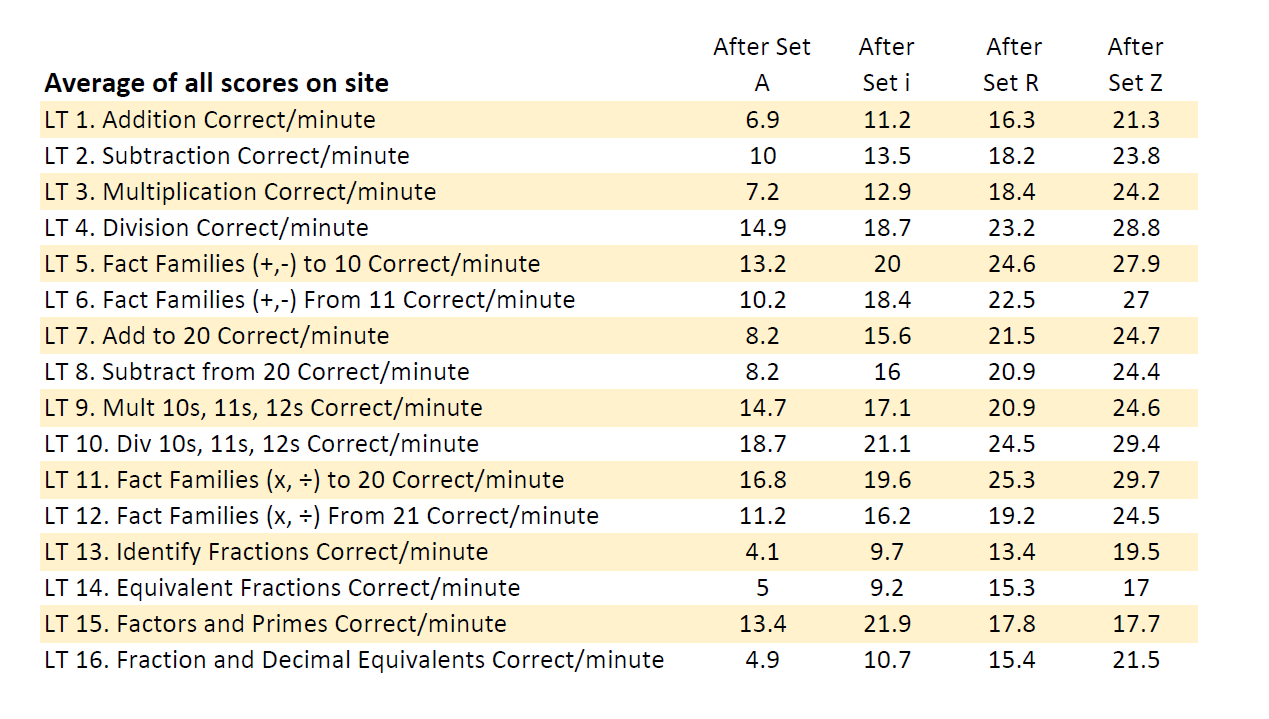
As students work through the levels in each Learning Track in the Rocket Math Online Game, they are periodically assigned fluency tests. Students are tested after completing levels A, i, and R, and then after they finish level Z. Each test is a 1-minute fluency test of a random selection of facts taught in that Learning Track. Therefore the scores are comparable, and when the number goes up at each point in the curriculum, you can be sure that students are increasing in fluency. As you can see from the site-wide data shown here, students consistently improve in fluency as they work through the Rocket Math Online Game. You would not expect students to meet benchmarks until they have completed Set Z in the Learning Track.
Math fact fluency benchmark in the Online Game: 20/minute
The 1-minute RACEs in the Rocket Math Online Game are a good way to measure math fact fluency. You can see from the site-wide averages above that on average, students exceed 20 per minute correct at Set Z, and the average at the beginning is much less. So a reasonable benchmark is 20 correct problems per minute.
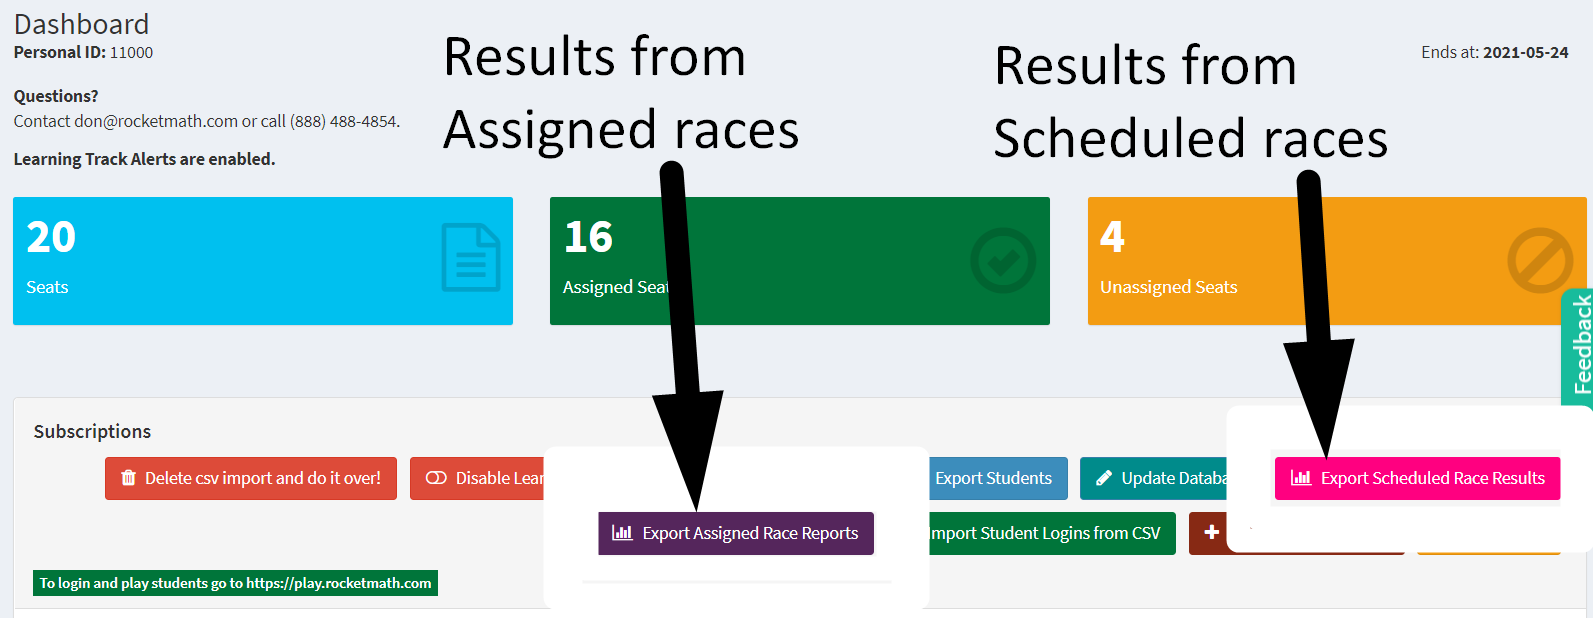
The teacher can assign a 1-minute RACE at any time, and the student will need to do it upon their next login. The results will be available in the Review Progress screen and export from the button that gives “Results from Assigned races.” However, the best measure of whether students can meet the benchmark is after Set Z, when they have completed the Learning Track. By clicking on the pink button for exporting “Results from Scheduled races,” the score will appear.
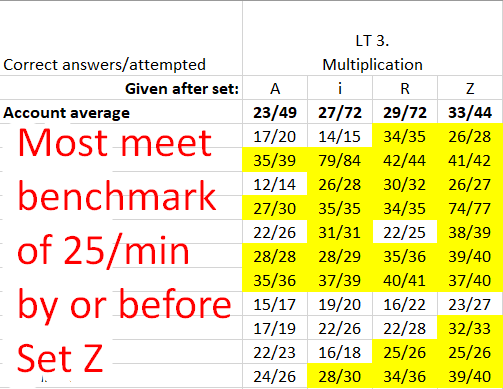 To the right is a screenshot of an example of the results from scheduled races from one class of upper elementary students. You can see the Account Average shows improvement at each level. If you set a benchmark at 25, you see all but one of the students met that by the end of Level Z. However, we do see several students who began above that level. (They need not have gone through the Learning Track, but most improved anyway.) After Set Z, those scores show that nearly all students are proficient by the end of the Learning Track. So we know that the Online Game is an effective intervention. But there’s a catch. For this display, we eliminated a lot of students who had not completed Set Z in Multiplication. Students have to play the game to learn.
Students must participate to learn: Monitor and Recognize Effort
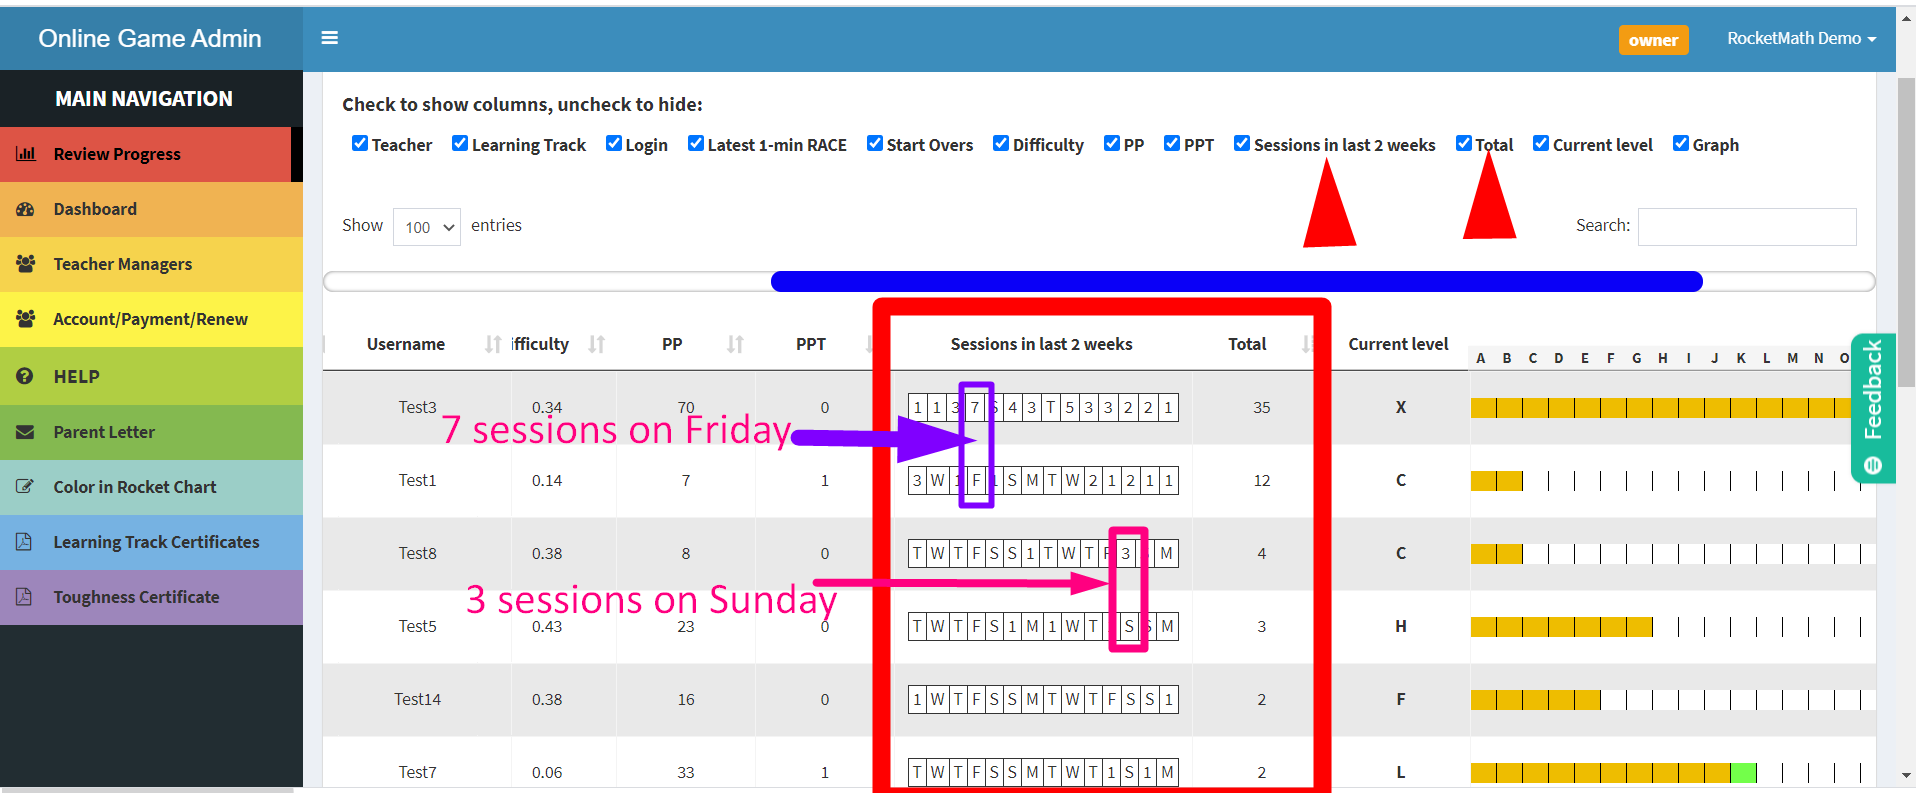 Assigning an effective intervention will not help unless students are engaged and participate. Instead of reporting on benchmarks of academic achievement, why not report on benchmarks of effort? Each time students login and complete a session (five, ten, or fifteen minutes in length) on the Online Game, the Review Progress screen will record their session. A mini calendar shows the number of sessions per day. As shown in this screenshot, one student completed 7 sessions on the previous Friday. Another student completed 3 sessions on Sunday. The students below the hard workers, whose mini-calendars showed “F” for Friday and “S” for Sunday, did not complete any sessions because there was no number for those days.
 Even more discriminative, the Review Progress screen shows the total number of sessions completed in the last two weeks. The picture shows data from our demo accounts. The one for Test3 shows 38 sessions in the last 14 days, while others have only 2 sessions. This total data tells us the level of effort students have been putting forth to learn their math facts. If you monitor this number and recognize students putting forth great effort, you’ll get more students participating. I would say that 10 to 14 sessions in the last two weeks are a good effort. 15 to 24 sessions is a very good effort. Any student with 25 or more sessions in the last two weeks is putting forth great effort and should be recognized as a star!
 You might consider giving out Award Certificates once a month for students who are putting forth super-star effort. If you reward effort, we guarantee you’ll get achievement. We have sets of Award certificates available on our supplements store site. Soon after doing that, you’ll probably have to start awarding Learning Track certificates for students who are completing Learning Tracks. Those are available on the Admin page on the light blue tab in the main rainbow navigation bar.
Using Rocket Math to Help Students Reach Math Benchmarks
Rocket Math Online Game and Worksheet program will help students reach each grade level math benchmark. By systematically teaching students to be math fact fluency, they will be able to not only succeed but learn to enjoy math.